Exploring Geospatial data in Elixir with Phoenix, D3, and PostGIS
January 28, 2016 -I noticed that Kaggle has started hosting some publicly available datasets. One of which is Ocean Ship Logbooks (1750-1850). I thought it would be interesting to visualize Captain Cook's travels on the HMS Endeavour using the Phoenix Web Framework, the D3 JavaScript library, and PostGIS.
Source code is available at this GitHub repo.
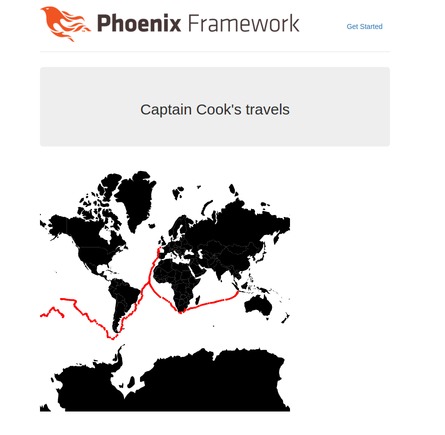
Captain Cook's Journeys on the Endeavor
Docker
For simplicity in this example we'll be using the mdillon/postgis Docker image. If you already have PostGIS installed or do not want to use Docker feel free to skip this section.
# Create a persistent data volume
$ sudo docker create -v /var/lib/postgresql/data \
    --name postgres-ocean-ships-data busybox

# Create the postgis container
$ sudo docker run --name postgres-ocean-ships -p 5432:5432 \
    -e POSTGRES_PASSWORD=postgres -d --volumes-from postgres-ocean-ships-data \
    mdillon/postgis:9.4
You can double check everything is working by connecting to Postgres. When prompted, the password will be "postgres", but you should consider using a much better one.
If you have psql installed locally you can do it like so:
$ psql -h localhost -p 5432 -U postgres
Otherwise you can also use the one in the container and connect with these commands:
$ sudo docker exec -i -t postgres-ocean-ships bash
root@10499abd059e:/# psql -h localhost -p 5432 -U postgres
Now that the containers are set up, in the future you can start and stop the PostGIS container like this:
$ sudo docker start postgres-ocean-ships
$ sudo docker stop postgres-ocean-ships
Phoenix
Create the Phoenix app:
$ mix phoenix.new ocean_ship_logbooks
$ cd ocean_ship_logbooks/
$ mix ecto.create
Add these Elixir CSV and Geo libraries to your mix.exs dependencies.
{:csv, "~> 1.2.3"}
{:geo, "~> 1.0"}
Fetch them
$ mix deps.get
We are going to be using be using the CSV library to parse the data, and the Geo library to work with PostGIS (via Ecto), so add to your config files (dev.exs, test.exs, and prod.secret.exs):
extensions: [{Geo.PostGIS.Extension, library: Geo}]
For example, the database section of tour config/dev.exs should now look something like:
# Configure your database
config :ocean_ship_logbooks, OceanShipLogbooks.Repo,
  adapter: Ecto.Adapters.Postgres,
  username: "postgres",
  password: "postgres",
  database: "ocean_ship_logbooks_dev",
  hostname: "localhost",
  pool_size: 10,
  extensions: [{Geo.PostGIS.Extension, library: Geo}]
Create database migrations
First we will want to enable the PostGIS extension in Postgres for our database. Lets generate a migration.
$ mix ecto.gen.migration enable_postgis
* creating priv/repo/migrations
* creating priv/repo/migrations/20160128183445_enable_postgis.exs
Edit 20160128183445_enable_postgis.exs so that the contents are this:
defmodule OceanShipLogbooks.Repo.Migrations.EnablePostgis do
  use Ecto.Migration

  def up do
    execute "CREATE EXTENSION IF NOT EXISTS postgis"
  end

  def down do
    execute "DROP EXTENSION IF EXISTS postgis"
  end

end
Now lets create ship data table.
Since the ship data will be accessed via a JSON API, you normally might generate a resource with the mix phoenix.gen.json task to create the model, migration, view, etc. code, but since we are using custom types from the Geo library we'll just create them manually.
$ mix ecto.gen.migration create_ship_data
* creating priv/repo/migrations
* creating priv/repo/migrations/20160128223253_create_ship_data.exs
We'll want to store the name of the ship, a timestamp, and a geometry object in the database, and we will be querying on the ship's name. Alter the file so that it has the following contents:
defmodule OceanShipLogbooks.Repo.Migrations.CreateShipData do
  use Ecto.Migration

  def change do
    create table(:ship_data) do
      add :ship,     :string
      add :utc,      :integer
      add :geom,     :geometry
    end
    create index(:ship_data, [:ship])
  end

end
Run the migrations:
$ mix ecto.migrate
ShipData Model
Create a file at web/models/ship_data.ex with these contents:
defmodule OceanShipLogbooks.ShipData do
  use OceanShipLogbooks.Web, :model
  schema "ship_data" do
    field :ship, :string
    field :utc,  :integer
    field :geom, Geo.Point
  end
end
This is a pretty straightforward model. We are using the Geo library so we can use a geometry column type that is specific to PostGIS.
ShipData View
Create a file web/views/ship_data_view.ex with these contents:
defmodule OceanShipLogbooks.ShipDataView do
  use OceanShipLogbooks.Web, :view

  def render("show_ships.json", %{ships: ships}) do
   %{ship_data: render_many(ships, OceanShipLogbooks.ShipDataView, "ship_data.json")}
  end

  def render("ship_data.json", %{ship_data: ship}) do
    {lat, lon} = ship.geom.coordinates

    %{ship: ship.ship,
      utc: ship.utc,
      lat: lat,
      lon: lon}
  end

end
Router
Look in web/router.ex for the api block. Uncomment it and change to look like this:
# Other scopes may use custom stacks.
scope "/api", OceanShipLogbooks do
  pipe_through :api
  resources "/ship_data", ShipDataController, only: [:index]
end
Ship Data Controller
Create a file web/controllers/ship_data_controller.ex with these contents:
defmodule OceanShipLogbooks.ShipDataController do
  use OceanShipLogbooks.Web, :controller
  alias OceanShipLogbooks.ShipData

  def index(conn, _params) do
    # For simplicity in this example we hard code against
    # a specific ship name.
    query = from s in ShipData,
    where: s.ship == "Endeavour",
    order_by: [asc: s.utc],
    select: s

    ships = Repo.all(query)
    render(conn, "show_ships.json", ships: ships)
  end


  # These next two functions probably do not belong in a controller,
  # since they are for manually importing data, but we put them in here
  # for this example.
  def import_from_csv() do
    File.stream!("ship-data.csv")
    |> CSV.decode(headers: true)
    |> Stream.filter(fn(x) -> x["Lat3"] != "NA" and x["Lon3"] != "NA" end)
    |> Stream.map(&build_ship/1)
    |> Enum.each(&OceanShipLogbooks.Repo.insert!/1)
  end

  defp build_ship(row) do
    {lat, _} = Float.parse(row["Lat3"])
    {lon, _} = Float.parse(row["Lon3"])
    {utc, _} = Integer.parse(row["UTC"])
    geom = %Geo.Point{ coordinates: {lat, lon}, srid: 4326}
    %OceanShipLogbooks.ShipData{ship: row["ShipName"], utc: utc, geom: geom}
  end

end
Download and clean the data.
Ensure you have downloaded the data the ship data from Kaggle. Extract the file CLIWOC15.csv into the root directory of your project (this file should be about 200 megabytes in size).
Unfortunately the Elixir CSV parser we are using is not RFC 4180 compliant and the ship data includes fields with escaped newlines. I did not investigate other Elixir or Erlang CSV parsers, so while not ideal, until this is fixed I removed the newlines with the following python script called transform_csv.py:
import csv

with open("CLIWOC15.csv", 'rU') as csvIN:
    with open('ship-data.csv', 'wb') as csvOUT:
        writer = csv.writer(csvOUT, delimiter=',', quoting=csv.QUOTE_ALL)
        for line in csv.reader(csvIN, delimiter=','):
            line = [x.replace('\n', '') for x in line]
            writer.writerow(line)
Run the script to remove extraneous newlines:
$ python transform-csv.py
Load the data into PostGIS
Run the app inside IEx (Interactive Elixir):
$ iex -S mix phoenix.server
iex(1)> OceanShipLogbooks.ShipDataController.import_from_csv
# Exit iex
Now verify the data is in PostGIS. Your session should look something like this:
$ psql -h localhost -p 5432 -U postgres ocean_ship_logbooks_dev

ocean_ship_logbooks_dev=# select count(*) from ship_data;
 count
--------
 252917
(1 row)


ocean_ship_logbooks_dev=# select * from ship_data where ship = 'Endeavour' limit 4;
  id   |   ship    |    utc     |                        geom
-------+-----------+------------+----------------------------------------------------
 41085 | Endeavour | 1768110915 | 0101000020E610000024287E8CB97B35C03333333333D342C0
 41084 | Endeavour | 1768093011 | 0101000020E61000006666666666E62F40423EE8D9ACAA35C0
 41083 | Endeavour | 1768090513 | 0101000020E6100000545227A08988454000000000000024C0
 41082 | Endeavour | 1768090413 | 0101000020E6100000AE47E17A14CE4540D7A3703D0A5724C0
You can also query the data via the phoenix app:
$ iex -S mix phoenix.server

iex(1)> import Ecto.Query, only: [from: 2]
iex(2)> query = from s in OceanShipLogbooks.ShipData,
...(2)> where: s.ship == "Endeavour",
...(2)> limit: 4,
...(2)> select: s
iex(3)> ships = OceanShipLogbooks.Repo.all(query)
[%OceanShipLogbooks.ShipData{__meta__: #Ecto.Schema.Metadata<:loaded>,
  geom: %Geo.Point{coordinates: {-21.4833, -37.65}, srid: 4326}, id: 41085,
  ship: "Endeavour", utc: 1768110915},
 %OceanShipLogbooks.ShipData{__meta__: #Ecto.Schema.Metadata<:loaded>,
  geom: %Geo.Point{coordinates: {15.95, -21.6667}, srid: 4326}, id: 41084,
  ship: "Endeavour", utc: 1768093011},
 %OceanShipLogbooks.ShipData{__meta__: #Ecto.Schema.Metadata<:loaded>,
  geom: %Geo.Point{coordinates: {43.0667, -10.0}, srid: 4326}, id: 41083,
  ship: "Endeavour", utc: 1768090513},
 %OceanShipLogbooks.ShipData{__meta__: #Ecto.Schema.Metadata<:loaded>,
  geom: %Geo.Point{coordinates: {43.61, -10.17}, srid: 4326}, id: 41082,
  ship: "Endeavour", utc: 1768090413}]
Feel free to delete the CSV files to clear up a few hundred megs of disk space.
Download Countries GeoJSON
Get the GeoGSON data from this GitHub repo and put the geojson file at priv/static/js/world.geojson
This will let us draw a map of the world in D3.
HTML and Javascript code
Edit web/templates/page/index.html.eex to look like this:
<div class="jumbotron">
  <h2>Captain Cook's travels</h2>
</div>

<div id="d3_map"></div>

<script src="//d3js.org/d3.v3.min.js" charset="utf-8"></script>

<script>
  var shipData;
  var width = 500;
  var height = 500;
  var projection = d3.geo.mercator()
    .scale(80)
    .translate([width / 2, height / 2]);

  var svg = d3.select("#d3_map")
    .append("svg")
    .attr("width", width)
    .attr("height", height);

  d3.json("/js/world.geojson", createMap);

  function createMap(countries) {
    var geoPath = d3.geo.path().projection(projection);
    d3.select("svg").selectAll("path").data(countries.features)
      .enter()
      .append("path")
      .attr("d", geoPath)
      .attr("class", "countries");
  };

  function makeRequest(url) {
    httpRequest = new XMLHttpRequest();
    if (!httpRequest) {
      console.log('Cannot create an XMLHTTP instance');
      return false;
    }
    httpRequest.onreadystatechange = jsonContents;
    httpRequest.open('GET', url);
    httpRequest.send();
  }

  function jsonContents() {
    if (httpRequest.readyState === XMLHttpRequest.DONE) {
      if (httpRequest.status === 200) {
        var response = JSON.parse(httpRequest.responseText);
        shipData = response.ship_data;
        drawCircle(shipData.slice(0));
      } else {
        console.log('There was a problem with the request.');
      }
    }
  }

  function drawCircle(shipDataCopy) {
    // if no data, erase the circles from the map and start over
    if (shipDataCopy.length == 0) {
      svg.selectAll("circle").remove();
      setTimeout(function() { drawCircle(shipData.slice(0))}, 50);
      return;
    }

    shipDatum = shipDataCopy.shift();

    d3.select("svg")
      .append("circle")
      .style("fill", "red")
      .attr("r", 2)
      .attr("cx", function(d) {return projection([shipDatum.lon,shipDatum.lat])[0]})
      .attr("cy", function(d) {return projection([shipDatum.lon,shipDatum.lat])[1]});

    setTimeout(function() { drawCircle(shipDataCopy) }, 50);
 }

makeRequest("/api/ship_data");

</script>
Now start the server
$ mix phoenix.server
Open a web browser to http://localhost:4000 to see an animation like at the top of this post and a page that should look something like this: